Priority can be an every shifting target, much to the dismay of the product manager. In early stage startups that can mean larger pivots with minimal data, compared to more established startups with smaller pivots and mounds of data.
Every new idea coming through, and on every change of direction, priorities need to be re-evaluated in a comparative way. Here are a few of the priority frameworks I rely on, and a bit about how and when they might be implemented.
RICE Scoring
RICE scoring was popularised by Intercom as a quick method of prioritising a list of potential features.
RICE is an acronym for:
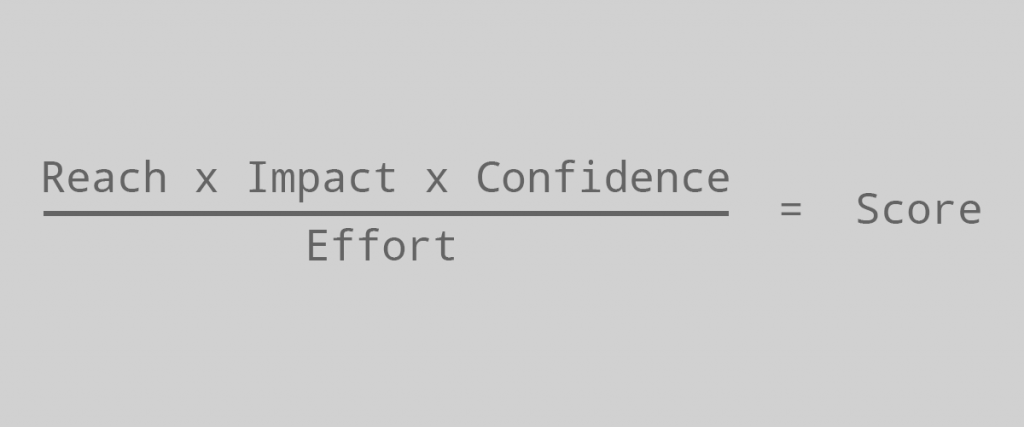
- Reach: How many users will this feature reach?
- Impact: How much will this impact each user?
- Massive – 3x modifier
- High – 2x modifier
- Medium – 1x modifier
- Low – 0.5x modifier
- Minimal – 0.25x modifier
- Confidence: How sure are you of your assumptions?
- High – 100%
- Medium – 75%
- Low – 50%
- Effort: How many “person months” will it take to complete? Estimated in half month blocks and is easily as possible.
With each of the building blocks, you can calculate the total RICE score.
Example: A few customers have asked about making their tricycles faster. We have interviewed some customers and internal stakeholders which has brought to light a few oppotunities.
| Feature | Reach | Impact | Confidence | Effort | Total Score |
| Racing stripes | 100000 | Low – 0.5x | Medium – 75% | 2 | 18750 |
| Motorised wheels | 80000 | High – 2x | High – 100% | 5 | 32000 |
| Jet engine | 4000 | Massive – 3x | Low – 50% | 30 | 200 |
Here is a link to Intercom’s RICE spreadsheet to quickly test your theories against this framework.
Weighted Scoring
Weighted scoring allows for a list of features to be compared against various criteria of your choosing. Similar to RICE scoring, a total score is calculated to see how valuable features are based on what is important to the business today.
The criteria can be anything measureable against a certain feature being built, loosely or accurately. Outside of RICE criteria, some common inclusions are:
- ROI
What is the return on investment for this feature? - Vision Alignment
How much does this feature align with our product vision? - Cost
How expensive would this feature be to produce?
Once you know the criteria to measure against, each item must be assigned a percentage out of a total of 100 based on the current strategy.
The business might be focused on entering new markets for the year. Criteria such as “Target Market Alignment” might be weighted with 40%, whereas the cost is less important during high growth such as 20%.
Once all criteria has been defined, features can be listed in a table and marked down for each criteria on a 0-5 or 0-10 scale. Finally the numbers are multiplied by the corresponding criteria percentages, then added together to give a final score.
Example: We are focusing for the year on entering the “Tricycles for teenagers” market. The criteria and weighting is as follows:
- Target Market Alignment: 35%
- Cost: 20% (Higher scoring represents lower cost)
- Effort: 25% (Higher scoring represents lower effort)
- Sustainability: 20%
| Feature | Market Alignment | Cost | Effort | Sustainability | Total Score |
| Cellphone holder | 8 (x 0.35) | 6 (x 0.2) | 6 (x 0.25) | 4 (x 0.2) | 6.3 |
| Hoodie storage compartment | 7 | 3 | 2 | 5 | 4.55 |
| Tyre burnout button | 7 | 2 | 3 | 3 | 4.2 |
Here is a link to my Weighted Scoring Template to try this method out for yourself.
MoSCoW Method
The MoSCoW method was popularised by Oracle in the mid 90s. Primarily useful for a list of requirements/features for a certain timeframe or release/increment. MoSCoW places requirements into 4 buckets:
- Must-have
These are items that must be delivered within the given timeframe. Typically the items in this bucket shouldn’t exceed 60% of total effort - Should-have
These items should be included in the release and would have a moderate impact if they are not. Total effort of items in this bucket and the must-haves shouldn’t exceed 80%. - Could-have
Once the above items have been complete, these items can be worked on and would have a minor impact if not released. Total effort of all 3 above buckets shouldn’t exceed 100% of total effort. - Wont-have
Wont-haves are not planned to be released. This is to ensure focus can be placed on the more important items, but can be worked on once 100% of the above items are complete but seldom are.
Example: A new solar-powered tricycle is required.
| Must-have | Should-have | Could-have | Won’t have |
| – Wheels and pedals – Frame and seat – Solar panels | – Handlebar grips – Battery shield | – Juice box holder – External charging | – Nuclear reactor – AI navigation |
While this method is great for breaking down requests into prioritized groups, establishing which buckets items should fall into requires more qualitative and quantitative data to identify.
Weighted Shortest Job First (WSJF)
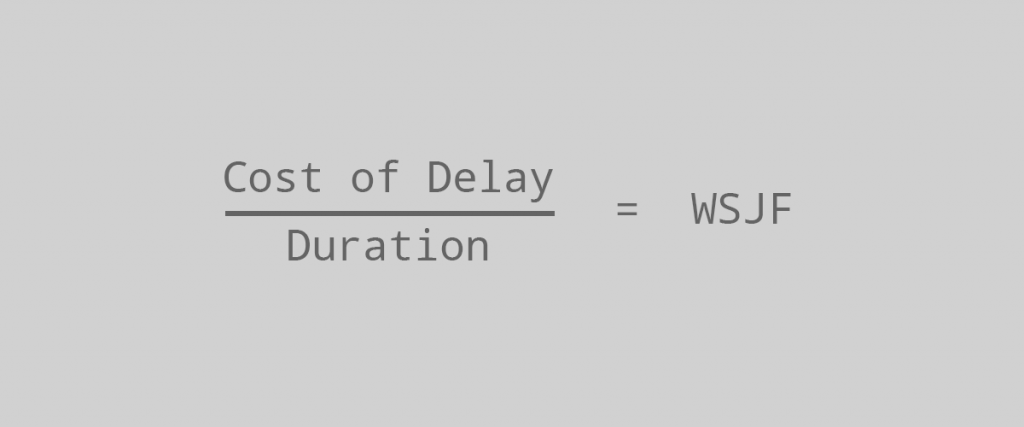
WSJF is a method from SAFe (scaled agile framework), developed to find the features which provide the greatest economic value. There are 2 pieces to calculate WSJF:
- Cost of Delay (CoD)
If this feature is not completed first, what revenue or other benefits reduced to an economic way are lost over a specified period of time (month). - Job Duration
Usually marked as effort in other frameworks, how many months will it take to implement this feature.
Cost of delay can different to each business, but a few common attributes are:
- User Business Value
How valuable is this to a user? What is the revenue impact for not delivering this earlier? Are there other negative effects due to delay? - Time Criticality
Does this value become less valuable over time? Will users wait for this to be implemented or move onto another platform? How does this affect customer satisfaction? - Risk Reduction and/or Opportunity Enablement
How else does this affect our business? Does it reduce risk in a future release? Are new business opportunities available to us?
Once all of these have been evaluated, they can be added up to find your cost of delay. Once you have your duration and CoD, you can calculate the WSJF.
Example: Enhancements to the “Tricycles for pets” line.
| Feature | CoD | Duration | Weighted Score WSJF |
| A: Basket pillow | 3 | 5 | 0.6 |
| B: Toys holder | 4 | 3 | 1.33 |
| C: Water container | 2 | 4 | 0.5 |
With these scores established, we can map 2 different paths to demonstrate the value of the framework. The first option would be the sub-optimal path due to allowing cost of delay to accrue.

The first task taken is the least valuable on the WSJF scale, allowing A and B to cause additional costs.
Our second path would be taking the opposite and more optimal path.
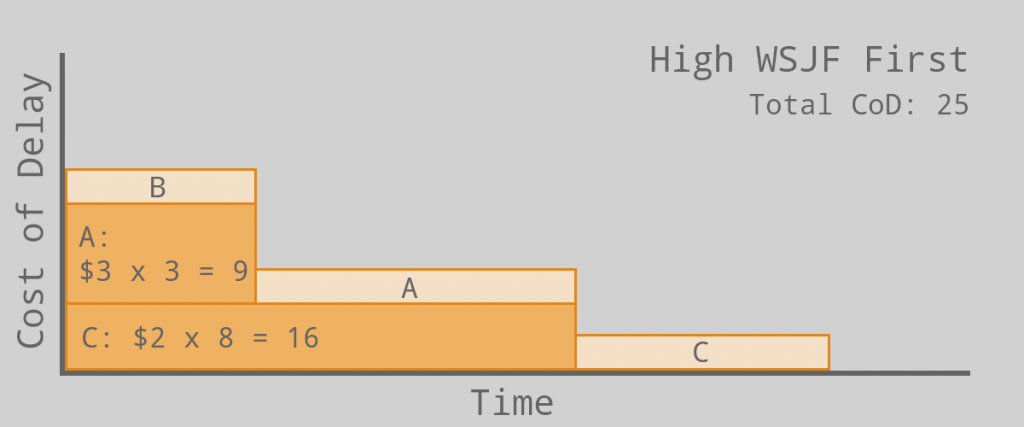
Working on the higher value jobs provide us with the least cost of delay accrued, hopefully delighting customers.
Opportunity Canvas
While not technically a prioritisation framework, it does help evaluate different opportunities and drive some discussions to use one of the other frameworks. The opportunity canvas allows you to drill down into why you are building certain features and the value they will provide.
A much more in depth explanation can be found here.
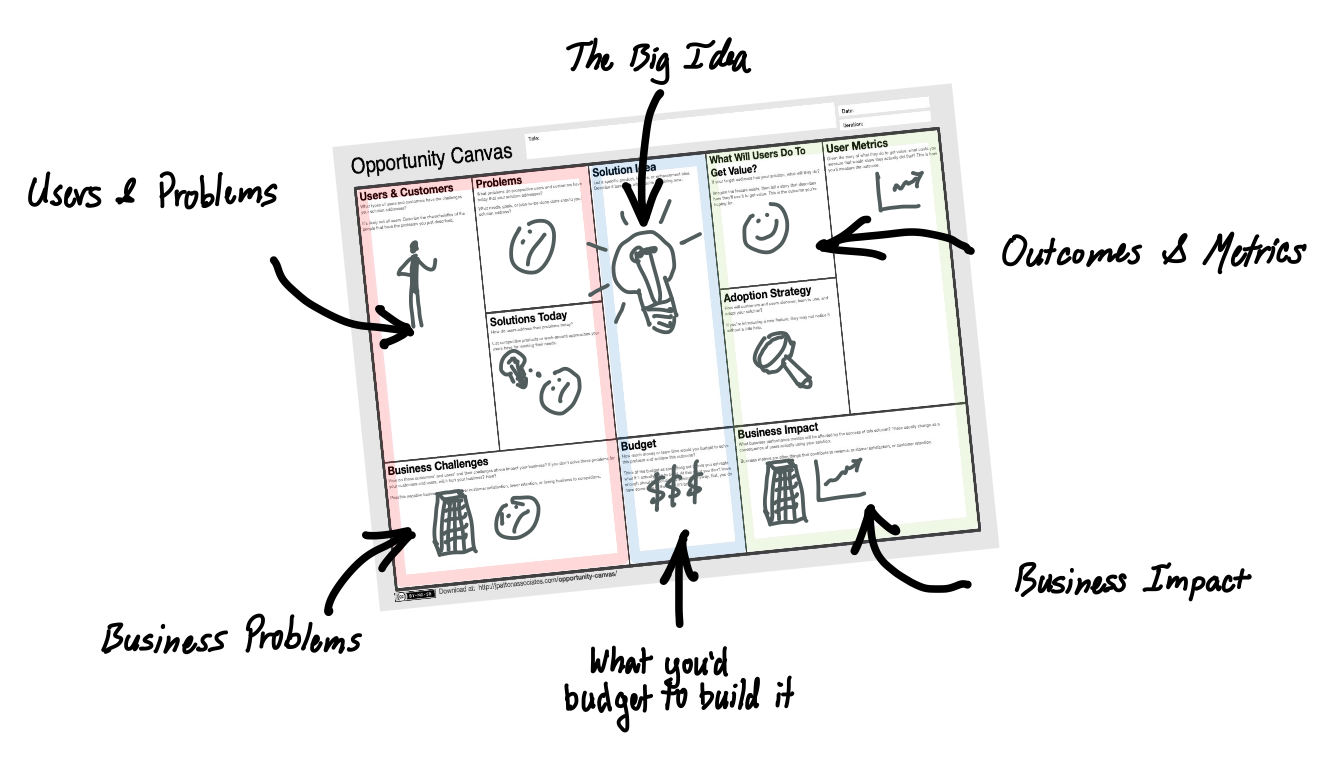
Each of the different sections can truely drill down into the issues that will occur, and the success that is expected. If you are finding more problems than positives, it may not be worth pursuing further.
Completing the canvas can be quite collaborative, especially with internal stakeholders that are bringing forward ideas. Demonstrating each of the quadrants will give a bigger picture and more buy in for why a feature is prioritised over another.
These are just a few of the frameworks to help guide the prioritisation process. There are many more out there with different purposes, and how they are utilised is dependent on the stage and maturity of the company, product team, and stakeholder alignment. Whichever framework you use, ensure you bring others along on the journey and demonstrate how everything is decided with the vision in mind.